Set up a monitoring dashboard to view your Kubernetes pod logs
Get all your pod logs on Kibana using Elasticsearch & filebeat.


Introduction
While it is possible to check the logs of pods running inside a Kubernetes cluster — simply by using kubectl logs <pod_name> command, it is always better (and convenient) to have a central monitoring dashboard where we can view those logs. This post will explain how we can set up such a dashboard using Elasticsearch, Kibana & filebeat.
My setup is done on macOS Big Sur, but the steps should be similar on the other platforms as well. Below is what my setup looks like.
- Elasticsearch version — 7.17.0
- Kibana version —
- Minikube version — v1.25.1
- macOS Big Sur 11.6.4
Requirements
- An Elasticsearch cluster. A single node installation, like on macOS, will also do. I installed mine using Homebrew.
- Kibana installed & configured.
- A Kubernetes cluster. Minikube will do.
- Filebeat installed (on Kubernetes) & configured.
Steps to follow
1. Configure Elasticsearch
By default, Elasticsearch listens to the traffic on localhost. We want Elasticsearch to be accessible from our Kubernetes cluster, so we have to expose it on the network. For this, we need to edit the elasticsearch.yml file.
On macOS Homebrew installation, edit the /opt/homebrew/etc/elasticsearch/elasticsearch.yml file & make the below change. Note that I just uncommented the network.host line & put 0.0.0.0 as the address.
# ---------------------------------- Network -----------------------------------
#
# By default Elasticsearch is only accessible on localhost. Set a different
# address here to expose this node on the network:
#
network.host: 0.0.0.0
You can also make it listen on a static IP address.
Restart Elasticsearch after making the change.
2. Configure Kibana
Our Kibana installation must be able to connect to Elasticsearch. Since we edited our Elasticsearch configuration, Kibana is no longer able to connect to Elasticsearch through localhost. For this, edit the kibana.yml file.
On macOS, the file location is /opt/homebrew/etc/kibana/kibana.yml. Just locate the below line, uncomment it & put the IP Address of the server on which Elasticsearch is running.
# The URLs of the Elasticsearch instances to use for all your queries.
elasticsearch.hosts: ["http://IP_Address:9200"]
Restart the service after making the change.
On macOS, the command to restart Kibana is…
brew services restart kibana-full3. Deploy filebeat on Kubernetes.
First, download the YAML manifest file.
Filebeat — Filebeat is a lightweight shipper for forwarding and centralizing log data. Installed as an agent on your servers, Filebeat monitors the log files or locations that you specify, collects log events, and forwards them either to Elasticsearch or Logstash for indexing.
curl -L -O https://raw.githubusercontent.com/elastic/beats/8.0/deploy/kubernetes/filebeat-kubernetes.yamlNow edit the files to update the Elasticsearch address. We have to do it in 2 places.
First, under output.elasticsearch section. Replace ELASTICSEARCH_HOST:elasticsearch with ELASTICSEARCH_HOST:<ip-_address of Elasticsearch>
output.elasticsearch:
      hosts: ['${ELASTICSEARCH_HOST:elasticsearch}:${ELASTICSEARCH_PORT:9200}']
      username: ${ELASTICSEARCH_USERNAME}
      password: ${ELASTICSEARCH_PASSWORD}
Then, under env.
env:
        - name: ELASTICSEARCH_HOST
          value: "ip-_address of Elasticsearch"
        - name: ELASTICSEARCH_PORT
          value: "9200"
Once the file has been modified, apply it to deploy the Kubernetes resources.
kubectl apply -f filebeat-kubernetes.yamlThe pods should come up in a few seconds.
Now that we have a running Kubernetes cluster that is able to communicate with Elasticsearch, it’s time to start viewing our pod logs.
4. Configure the Kibana dashboard.
Open Kibana dashboard — by default, it is accessible over 5601 port. Navigate to Stack Management ->Index Patterns (http://localhost:5601/app/management/kibana/indexPatterns) & ensure that filebeat* index is present. If not, then click the Create index pattern button to create it.

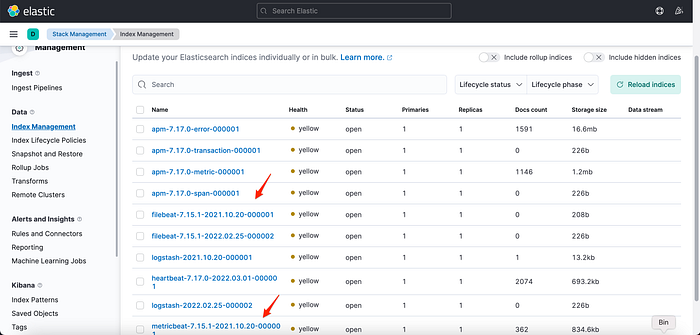
Once the index is created, you can check its status by navigating to Stack Management ->Index Management (http://localhost:5601/app/management/data/index_management/indices)

Now, browse to Discover (by clicking the hamburger menu just below the elastic log on the top left). Then select filebeat-* as index from the dropdown.
Under the Available fields, select kubernetes.pod.name & message by clicking the + icon. This will show you the logs for all your pods.

Now, in the KQL textbox, enter kubernetes.namespace : “default” if you want to monitor the logs of your pods running in the default namespace. If your namespace is different, enter that.
If your pods are running, you should see their logs in the dashboard now. You can see below that I am able to view the logs of my web-app running inside the pod.

That’s it for this post. Please do let me know if you liked this. You can also read my similar posts below.
